Threads Engagement Rate: What's Good & How to Calculate It (2026)
2026-03-12
If you are serious about growing on Threads, there is one metric that matters more than follower count, impressions, or even reach: your engagement rate. It tells you how well your content actually resonates with people — not just how many eyeballs see it, but how many people care enough to interact.
In this guide, we will break down exactly what engagement rate means on Threads, how to calculate it, what benchmarks you should aim for, and ten proven strategies to push your numbers higher. Whether you are a solo creator or running a brand account, this is the metric that separates accounts that grow from accounts that stall.
What Is Engagement Rate on Threads?
Engagement rate (ER) is the percentage of your audience that actively interacts with your content. On Threads, the three core engagement actions are:
- Likes — the most common and lowest-friction interaction
- Replies — the highest-value signal; replies indicate genuine interest and drive algorithmic reach
- Reposts (and quotes) — amplification actions that expose your content to new audiences
Your engagement rate takes the total of these interactions and divides it by either your follower count or total views, depending on which formula you use. Both approaches are valid, but they answer slightly different questions.
Follower-based ER tells you: "Of my existing audience, what percentage engages with my posts?" This is the most widely used method across social platforms and allows for easy comparison between accounts.
View-based ER (sometimes called "engagement rate by reach") tells you: "Of the people who actually saw this post, what percentage engaged?" This is more precise for evaluating individual post performance since not all followers see every post.
Understanding the difference matters. An account with 100,000 followers but low reach might have a poor follower-based ER but an excellent view-based ER. The content is good — the distribution just is not there yet. Conversely, a viral post with millions of views but relatively few interactions could show a low view-based ER despite generating thousands of likes.
How to Calculate Your Threads Engagement Rate
Formula 1: Follower-Based Engagement Rate
ER = (Likes + Replies + Reposts) / Followers × 100
Example: You have 5,000 followers. Your latest post received 200 likes, 35 replies, and 15 reposts.
ER = (200 + 35 + 15) / 5,000 × 100 = 5.0%
That is a strong engagement rate. Your audience is clearly responding to this content.
Formula 2: View-Based Engagement Rate
ER = (Likes + Replies + Reposts) / Views × 100
Example: The same post was seen by 8,500 people.
ER = (200 + 35 + 15) / 8,500 × 100 = 2.94%
Formula 3: Average Engagement Rate (Across Multiple Posts)
For a more reliable picture, calculate ER across your last 10–30 posts:
Average ER = Sum of (Individual Post ER) / Number of Posts
Example: You calculate the ER for your last 20 posts, and they range from 1.2% to 7.8%. The sum is 72.4%.
Average ER = 72.4 / 20 = 3.62%
This average smooths out outliers — that one viral post or that one flop — and gives you a true baseline.
Why Manual Calculation Gets Tedious Fast
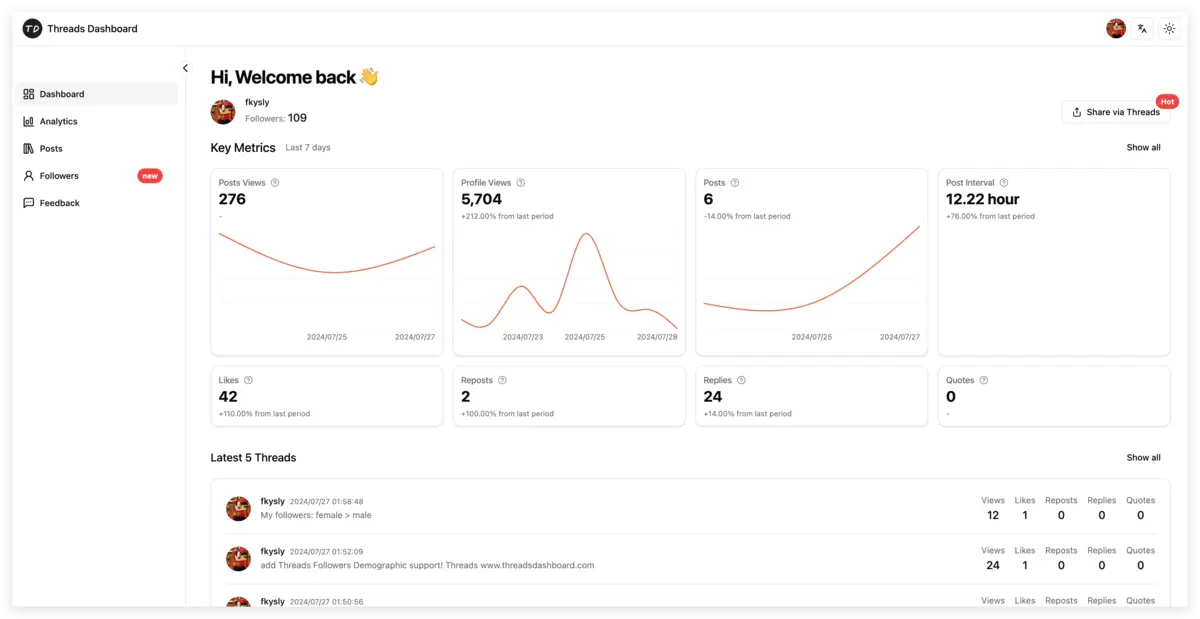
If you are posting daily, calculating ER manually across 30 posts means opening each post, writing down likes, replies, reposts, and views, then plugging everything into a spreadsheet. Most creators abandon this after a week. That is exactly why tools like ThreadsDashboard exist — they pull your Threads data automatically and calculate engagement rates for every post, so you can focus on creating content instead of crunching numbers.
Engagement Rate Benchmarks: What Is Good on Threads?
Based on aggregated data from thousands of Threads accounts across various niches and follower counts, here are the benchmarks you should know:
| Engagement Rate | Rating | What It Means | | --------------- | --------- | -------------------------------------------------------------------------- | | Below 1% | Low | Your content is not resonating. Time to rethink your strategy. | | 1% – 3% | Average | Solid foundation. Most established accounts fall here. | | 3% – 6% | Good | Your audience is genuinely engaged. You are doing something right. | | 6%+ | Excellent | Top-tier performance. Common in tight-knit communities and niche creators. |
How Follower Count Affects Benchmarks
Engagement rate almost always drops as follower count increases. This is normal and expected:
- Under 1,000 followers: Average ER of 5–8%. Small but loyal audiences interact at high rates.
- 1,000 – 10,000 followers: Average ER of 3–5%. The "sweet spot" where growth and engagement coexist.
- 10,000 – 50,000 followers: Average ER of 2–4%. Maintaining above 3% here is genuinely impressive.
- 50,000 – 100,000 followers: Average ER of 1.5–3%. At this scale, even 2% represents thousands of interactions.
- 100,000+ followers: Average ER of 1–2%. Many major accounts hover around 1.5%, and that is perfectly healthy.
If you have 50,000 followers and a 4% engagement rate, you are outperforming the vast majority of accounts at your size. Context matters.
Threads vs Other Platforms
Threads generally delivers higher engagement rates than Instagram or X (Twitter) for the same account size. As of early 2026, the platform still favors organic reach over pay-to-play distribution, which means quality content gets rewarded more generously. Expect this advantage to narrow as the platform matures.
Factors That Affect Your Engagement Rate
Understanding why your ER fluctuates helps you make smarter content decisions.
1. Content Type
Text-only posts that spark opinion or emotion consistently outperform generic statements. Threads with a personal story or hot take tend to generate 2–3x more replies than informational posts. Carousel-style threads (multi-paragraph breakdowns) perform well for educational content but may get fewer reposts.
2. Posting Time
Posting when your audience is active makes a measurable difference. The first 30–60 minutes after publishing are critical — if a post gains early traction, the Threads algorithm pushes it further. Posting at 3 AM when your audience is asleep kills that initial momentum.
3. Audience Size and Composition
A niche audience of 2,000 fitness coaches will engage at dramatically higher rates than a general audience of 50,000 mixed followers. Specificity drives engagement because your content speaks directly to their interests.
4. Niche and Industry
Some niches naturally generate more engagement. Personal development, finance, fitness, and tech tend to have passionate audiences that interact heavily. More passive niches like landscape photography or news aggregation typically see lower reply rates.
5. Posting Frequency
There is a sweet spot. Posting once a week leaves your audience disengaged. Posting five times a day fatigues them. For most accounts, one to three quality posts per day maximizes engagement without burning out your audience or diluting your ER.
6. Reply Behavior
Accounts that actively reply to comments on their own posts see measurably higher engagement on subsequent posts. The algorithm notices when a thread becomes a conversation, and it rewards that activity with more distribution.
How to Check Your Engagement Rate
Method 1: Manual Calculation
Open any Threads post, note the likes, replies, and reposts. Divide by your follower count. Multiply by 100. Repeat for every post you want to analyze. This works but does not scale.
Method 2: Spreadsheet Tracking
Create a spreadsheet with columns for date, post content, likes, replies, reposts, views, and calculated ER. Update it daily. This gives you trend data over time but requires consistent discipline.
Method 3: Use ThreadsDashboard (Recommended)
ThreadsDashboard connects directly to the Threads API and automatically calculates your engagement rate for every post. You get:
- Per-post engagement rate broken down by likes, replies, and reposts
- Average engagement rate over any time period — 7 days, 30 days, 90 days
- Engagement trends so you can see whether your ER is climbing or declining
- Post-by-post comparison to identify which content types drive the highest engagement
- Follower growth correlation — see how engagement rate changes as your audience grows
Instead of spending 20 minutes per day on manual calculations, you open one dashboard and see everything. For creators and brands who treat Threads as a growth channel, this is a no-brainer.
10 Ways to Improve Your Threads Engagement Rate
1. Open With a Hook
The first line of your post determines whether people stop scrolling or keep going. Start with a bold claim, a surprising statistic, or a direct question. "Most Threads creators have no idea their engagement rate is declining" hits harder than "Here are some tips about engagement."
2. Ask Questions — Real Ones
Posts that end with a genuine question generate 40–60% more replies than statements. The key word is genuine. "What do you think?" is lazy. "What is the one post format that consistently outperforms everything else for you?" is specific and invites a real response.
3. Post at Optimal Times
Use your analytics data to identify when your specific audience is most active. This varies by niche, geography, and audience demographics. ThreadsDashboard shows you exactly when your followers are online and when your past posts have performed best, taking the guesswork out of scheduling.
4. Reply to Comments Within 30 Minutes
The first hour after posting is the engagement window. When someone replies to your post, reply back quickly. This does two things: it encourages more replies from others who see an active conversation, and it signals to the algorithm that your post is generating genuine discussion.
5. Share Strong Opinions
Neutral content does not generate engagement. Taking a clear stance — even a mildly controversial one — gives people a reason to agree, disagree, or share. "Follower count is the most overrated metric on Threads" is more engaging than "There are many metrics to track on Threads."
6. Tell Personal Stories
People connect with people, not brands or faceless accounts. Posts that share a personal experience, a failure, or a behind-the-scenes moment consistently outperform polished, corporate-style content. Vulnerability drives replies.
7. Use the Right Post Length
Short, punchy posts (under 50 words) work well for hot takes and questions. Longer, detailed posts (150–300 words) work for educational content and storytelling. What does not work is the middle ground — posts that are too long to be quick hits but too short to provide real value.
8. Create Series and Recurring Formats
When your audience knows what to expect, they look for it. "Monday Metrics" or "Weekly Threads Teardown" builds anticipation and habitual engagement. Recurring formats also make content creation easier because you are not starting from scratch every time.
9. Engage on Other People's Posts First
Engagement is reciprocal. Spending 15 minutes before you post replying thoughtfully to posts in your niche warms up the ecosystem. People notice who consistently shows up in their comments, and they return the favor.
10. Analyze and Double Down on What Works
This is where data beats intuition. Look at your top 10 posts by engagement rate over the last 30 days. What do they have in common? Is it the topic, the format, the posting time, the tone? Do more of that. Tools like ThreadsDashboard make this analysis effortless — sort your posts by engagement rate, spot the patterns, and replicate what works.
Engagement Rate vs Vanity Metrics
Follower count is the most visible number on any social profile, and it is also the most misleading. Here is why engagement rate is a far better indicator of account health:
An account with 10,000 followers and a 5% ER generates 500 interactions per post. These are people who care enough to like, reply, or share. They are potential customers, collaborators, or advocates.
An account with 100,000 followers and a 0.5% ER also generates 500 interactions per post — the same number despite having 10x the followers. Worse, a low ER signals to the algorithm that the audience is disengaged, which reduces future reach.
Brands increasingly look at engagement rate when evaluating potential partners for sponsorships and collaborations. A creator with 8,000 highly engaged followers is often more valuable than one with 80,000 passive ones. If you are building a business on Threads, ER is the metric that directly correlates with monetization potential.
Impressions and reach matter too, but only in context. High impressions with low engagement means the content is being shown but not connecting. That is useful diagnostic information — it tells you the distribution is working but the content needs improvement.
Tracking Engagement Over Time
A single engagement rate snapshot tells you almost nothing. What matters is the trend. Is your ER climbing week over week? Is it declining as you gain followers (and by how much)? Did a specific content shift cause a noticeable change?
What to Track Weekly
- Average ER across all posts — your headline metric
- ER by content type — separate text posts, image posts, and longer threads
- ER by posting time — identify your optimal windows
- ER relative to follower growth — some ER decline during rapid growth is normal
Monthly Review
Once a month, do a deeper analysis:
- Compare this month's average ER to last month
- Identify your top 5 and bottom 5 posts by ER — look for patterns
- Check whether specific topics or formats are trending up or down
- Assess whether posting frequency changes impacted engagement
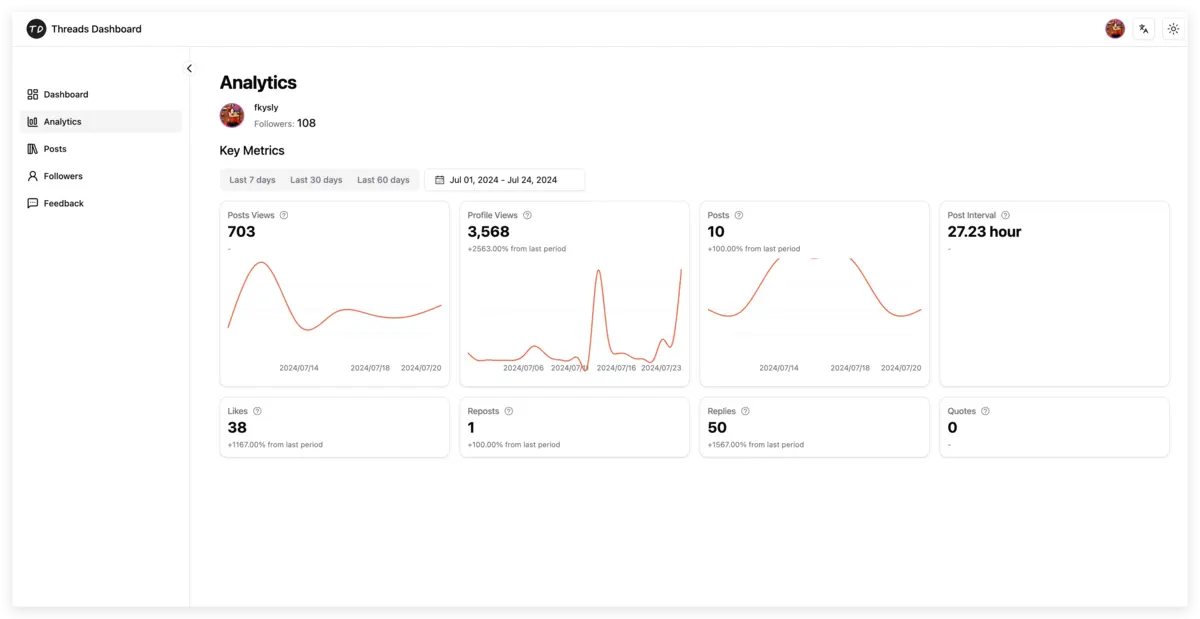
Using ThreadsDashboard for Trend Analysis
ThreadsDashboard provides built-in trend visualization that makes this kind of analysis straightforward. You can filter by date range, see ER plotted over time, and compare different content categories side by side. Instead of maintaining a manual spreadsheet that you will inevitably abandon, you get automated tracking that updates every time you log in.
The most actionable insight usually comes from comparing your best and worst performing posts. When you can clearly see that question-based posts average a 4.8% ER while announcement posts average 1.2%, the content strategy practically writes itself.
Final Thoughts
Engagement rate is the single best indicator of how well you are doing on Threads. It cuts through the noise of vanity metrics and tells you whether your content actually connects with real people. The math is simple — the hard part is tracking it consistently and making data-driven decisions based on what you find.
Start by calculating your current average ER across your last 20 posts. That is your baseline. Then implement the strategies above, track the impact over the next 30 days, and adjust. Growth on Threads is not about posting more — it is about posting smarter, engaging authentically, and letting the data guide your decisions.
The creators and brands winning on Threads in 2026 are the ones who treat engagement rate as their north star metric. Now you have the framework to do the same.